Cloud Fraction and Deforestation in the Amazon
Introduction
Deforestation in the Amazon is currently one of the greatest environmental threats. Land use, typically in agriculture and energy production have led to deforestation and have presented severe loss in biodiversity as well as increases in CO2. Losses in Earth’s biosphere due to deforestation have been clear and prevalent, but the effects to the atmosphere may be overlooked. Changes in land can cause severe shifts in climate and weather patterns. In its most extreme case, deforestation could lead to desertification. By analyzing satellite images across the Amazon Basin, we can quantify how the atmosphere may be affected by deforestation.
In this research project, we analyze changes in Cloud Fractions across the periods of 2004-2018 from the NASA Aura satellite’s Ozone Monitoring Instrument (OMI). All the code and associated files are contained in my GitHub repository and can be found at: https://github.com/Argentum133/Cloud-Fractions-Amazon-Basin
Analyzing Cloud Fraction
Cloud fraction is the percentage of pixels in an image covered with clouds. It is therefore a good representation of cloud cover. Cloud fraction is a unitless measurement ranging from 0-1 with 1 representing pixels that are entirely covered by clouds and 0 having no clouds.
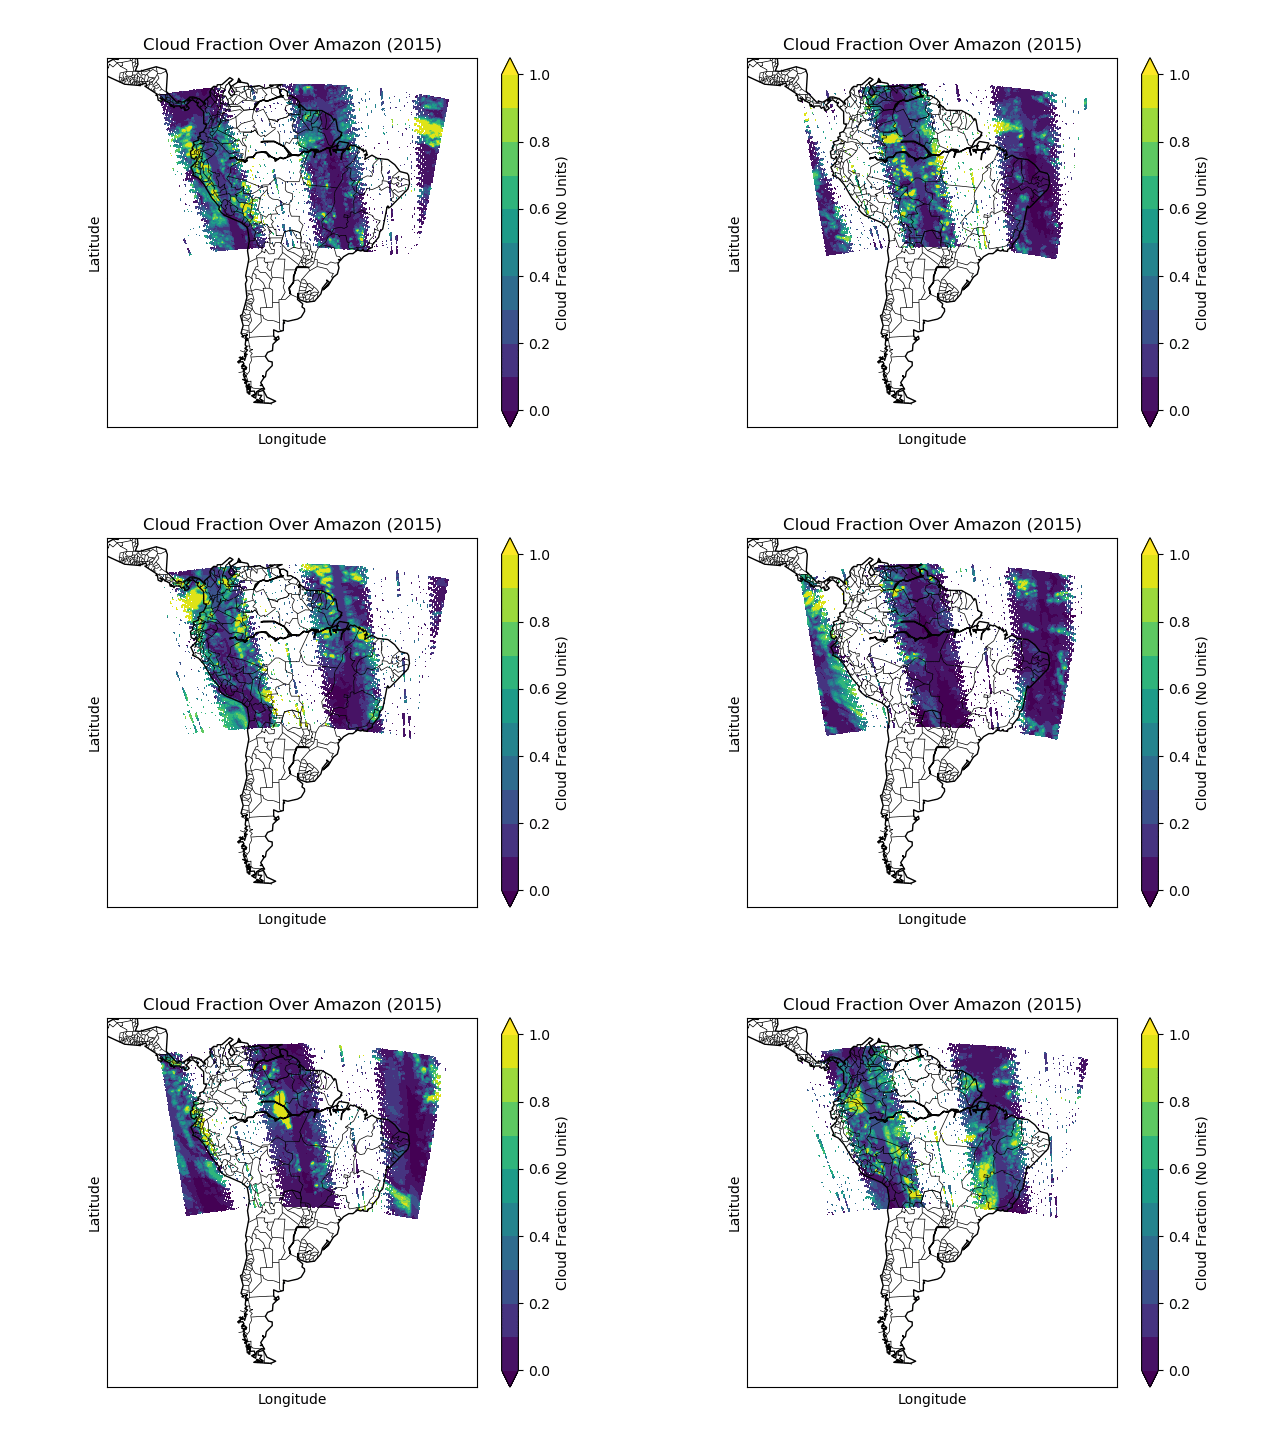
From the image above, we can see the data is stored as an HDF 2-d array. Over this 14-year period there was about 5000 files which amounts to around 1 per day. For easy analysis, I decided to use Python to loop through the images. Below is an animation that loops through and plots all the cloud fraction data onto a map for 2015.

We can see that looking through 5000 maps might become tedious, so in order to make long-term trends, I aggregated the cloud fraction data into one value per image. Reading all the files in Python, I created a separate .csv datafile that contained the average cloud fractions of each file. The first .csv file is titled “CloudFracDataWhole.csv” and can be found my GitHub Repository that I linked above (*note: I later created another data-set that converted the date tags to Gregorian days to make future data analysis simpler”).
Results
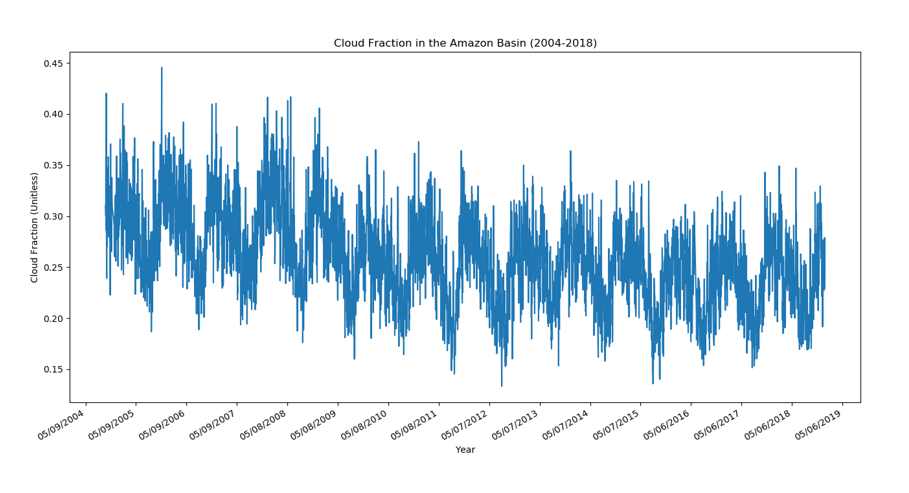
Here is the complete plot of all the averaged cloud fraction values across the Amazon Basin.

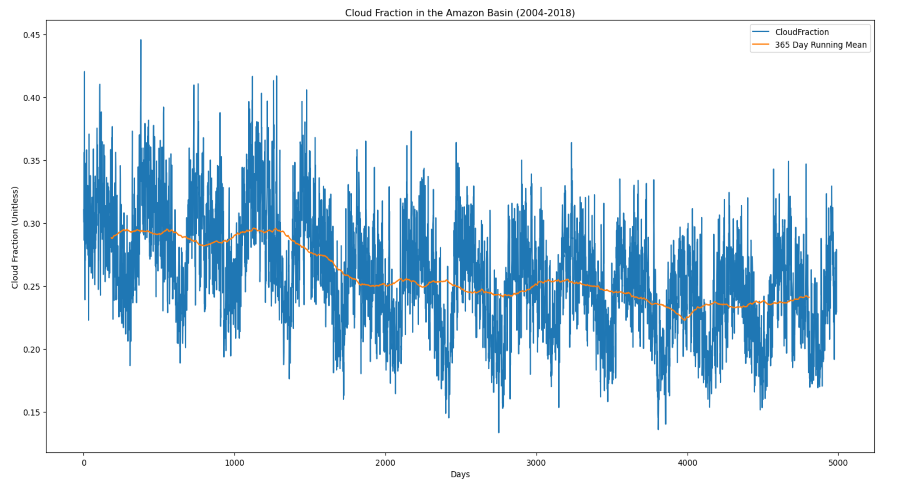
As you can see, there is a downward trend masked by seasonal trends. A good way to filter these seasonal effects is to apply a running-mean with a 365-day window. If you are unfamiliar with the running mean, it is a process that analyzes data points by creating a series of averages of different subsets of the full data set. Given a series of numbers and a fixed subset size, the first element of the running mean is obtained by taking the average of an initial “window” or subset of the data. The window is then “shifted forward” throughout the series. By applying a window of 365 days (or a year), the model analyzes each individual day’s values and assimilates into a yearly pattern. In our case, the effects of Earth’s seasons are removed, and the overall long-term trends are highlighted.

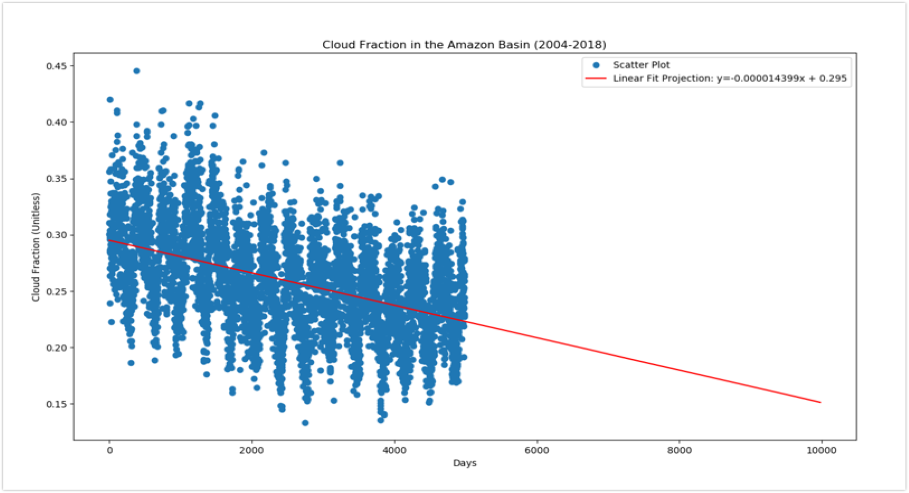
Using numpy’s polyfit regression tool, we can gain a sense of what a long-term trend might look like. In the 14-year period that the satellite captured data, there was around a 20% decrease in cloud cover. Extending the regression to another 14 years, we can see that cloud fractions in the Amazon will suffer a nearly 50% decrease.

Conclusion
The results from this study are quite worrying, especially given how the Amazon Basin serves as one of Earth’s greatest environmental havens. This 50% decrease in cloud cover is assuming that deforestation activity stays the same and is under the assumption that there are no accelerated atmospheric feedback effects. If these trends are to hold, we could expect to see a drier atmosphere that would have an increased response to evaporation. Furthermore, the lack of cloud cover could increase the amount of radiation absorbed by the Earth quite literally making things warmer. A continual chain of a hotter land surface and an increasingly hot atmosphere could have disastrous effects. This could support a hypothesis of desertification whereby the loss of cloud cover could further prevent weather phenomena such as precipitation. What remains clear is that the continued loss of clouds in the Amazon will further impact biodiversity loss and other environmental disturbances.
Land use and land cover change presents one of the greatest environmental threats and presents major setbacks for climate change mitigation efforts. With evermore increasing populations and development goals that are equally ambitious, humankind finds itself at a crossroads between social and economic betterment versus maintaining safe and clean environments. It is estimated that by 2050, our Earth will be home to 10 billion people. These people will have mouths to be fed, will require energy to power their lives, and will seek a piece of this land to claim as real estate. All these circumstances face many challenges: political and financial instabilities, national and international policies that impact land use, lack of technology and stable infrastructure, and above all, climate change. If we are to combat the effects of climate change, we must remember that the solution rests far beyond simply producing scientific results. This type of research can show the thinning timeline we have to solve these problems, but it can also give truth to power and inspire change.
Please feel free to contact me at the links provided below if you have any questions about my research.
-Jaemin Eun